
Contents
1. Why bother?
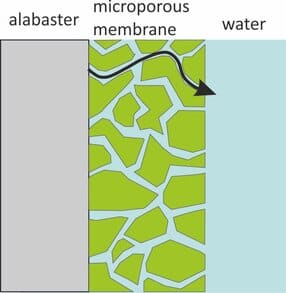
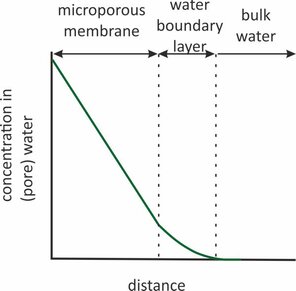
Sorbents in passive samplers of organic compounds are often covered by microporous membranes (pore size 0.03 – 10 μm). This is done to retain granular sorbents (POCIS), to reduce the flow sensitivity of the sampling rates (Chemcatcher), or to protect an underlying diffusion membrane from biodegradation (some o-DGT designs). These microporous membranes offer an additional resistance for transport between the water and the sorbent. This resistance is in series with the resistance of the water boundary layer. Knowledge of the membrane resistance is important because it sets an upper limit to the sampling rates that can be achieved, and also helps to understand flow effects on the sampling rates.
Polyethersulfone (PES) is the most common membrane material, but hydrophilic polytetrafluoroethylene (PTFE) and glass fiber filters have also been used. Transport can occur via the pore space and via the solid phase of the membrane. The high glass transition temperatures of PES (~217 °C) and PTFE (~119 °C) suggest very small diffusion coefficients in the solid phase. This make it unlikely that transport through the polymer is important for polar organic compounds, relative to transport through the pore space.
2. Rate control by microporous membrane
Transport through a porous membrane goes faster when the diffusion coefficient (Dw) in the pore water is higher, and when the porosity (φ) of the pore space is larger. Transport goes slower when the membrane is thicker and when the diffusion paths are more tortuous. The latter is expressed as tortuosity (τ), which can be seen as the length of the actual diffusion path divided by the thickness of the membrane. The sampling rate for fully membrane-controlled kinetics is given by
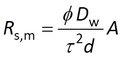
where A is the surface area and d is the membrane thickness. Porosities and tortuosities are generally unknown. Membrane thickness is given by manufacturers as a range (e.g. 110 to 150 μm) or as a typical value. But what we are really interested in is the group dτ2/φ , because it is a membrane property. Combining it with a compound specific diffusion coefficient yields the sampling rate for fully membrane-controlled kinetics of that compound. However, the water boundary layer is always present and we always have to deal with mixed rate control by membrane and water boundary layer.
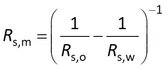
3. Mixed rate control
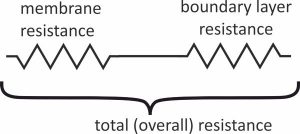
The sampling rate (Rs) can be seen as a conductivity. It tells you how easily a compound gets into the sorbent. One divided by Rs can be seen as a resistance. The overall resistance is the resistance of the water boundary layer plus the resistance of the membrane.
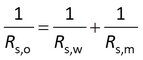
where Rs,m is the sampling rate that you would find for full membrane-controlled kinetics, and Rs,w is the sampling rate for full water boundary layer controlled kinetics. Rs,o is the overall sampling rate for mixed rate control by membrane and water boundary layer.
4. Rs,m from alabaster dissolution rates
At least two dissolution rate measurements are needed to obtain Rs,m:
with membrane : Δm1 = Rs,o C* t
without membrane : Δm2 = Rs,w C* t
where Δm is the mass loss, C* is the solubility of alabaster in the exposure water and t is time. Slightly different equations should be used when there is significant calcium sulfate concentration build-up in the water (Booij et al., 2017). PaSOC’s calculation template accounts for that.
Rs,m can be found by first measuring Rs,o and Rs,w, subtracting 1/Rs,w from 1/Rs,o and taking the inverse
The result will be more accurate when Rs,w is high; preferably infinite, but that is hard to achieve. To increase confidence in the data, this experiment can be repeated at the same flow settings or at different ones. But take care that the flow settings are not too low. At very low flows the kinetics would be controlled by the water boundary layer for both measurements, and information on the membrane resistance would not be accurate in that case.
The microporous membrane property dτ2/φ can be found from section 2 above

Dealing with the units can be a bit tedious here, as Rs is usually given in L/d and Dw in m2/s. Make use of the fact that there are 86400 seconds in a day. As a check of the calculations: dτ2/φ should be somewhere between 1 and 6 times the nominal thickness of the membrane.
5. Rs,m for organic compounds
Calcium sulfate has a higher Dw than most organic compounds (8×10⁻¹⁰ versus typically 5×10⁻¹⁰ m2/s at 20 °C). Rs,m for organic compounds is therefore expected to be 1.6 times smaller than for calcium sulfate. At temperatures near 20 °C this factor of 1.6 may be selected as a default. When better accuracy is needed, the diffusion coefficients of organic compounds at 25 °C may be obtained from molar volume or molecular weight as suggested by Schwarzenbach et al. (2016). The temperature dependency of Dw may be obtained from Hayduk and Laudie (1974).
6. Caveats
Dissolution rate measurements with and without a membrane should preferably be made at the same temperature. The reason for that is that Rs,w and Rs,m increase with the diffusion coefficient to the power 2/3 and 1, respectively.
When results for Rs,m are reported, it is important to specify at which temperature this was done, and to which compound the reported value applies. When results are reported as dτ2/φ this is less critical because this parameter is not temperature dependent.
7. How PaSOC can support
- PaSOC’s alabaster plates are custom made from high quality alabaster, mounted in a PVC protective housing that fits your specific sampler design. For ordering details see water boundary layer page, section 7.
- The plates come with a calculation template for the Rs,o and Rs,w of alabaster, taking the temperature dependency of calcium sulfate into account. The template also includes the estimation of organic compound Dw based on the methods outlined in the previous section.
- PaSOC gives support in case you run into practical or conceptual difficulties with this method. When you need a check on your calculations: send PaSOC an e-mail.
- PaSOC can also measure the microporous membrane property dτ2/φ for you.
8. Further reading
Booij, K., Maarsen, N.L., Theeuwen, M., van Bommel, R., 2017. A method to account for the effect of hydrodynamics on polar organic compound uptake by passive samplers. Environ. Toxicol. Chem. 36, 1517–1524. https://doi.org/10.1002/etc.3700
Hayduk, W., Laudie, H., 1974. Prediction of diffusion coefficients for nonelectrolytes in dilute aqueous solutions. AIChE J. 20, 611–615. https://doi.org/10.1002/aic.690200329
Schwarzenbach, R.P., Gschwend, P.M., Imboden, D.M., 2016. Environmental Organic Chemistry, 3rd ed. John Wiley & Sons, Hoboken, NJ, USA. ISBN 978-1-118-76723-8